大家好,这期介绍我的Homelab监控平台。本文只是个肤浅的入门简介,写给对监控平台感兴趣但是又像我一样小白的读者。文章中的情景只为举例说明监控平台的用法,不要用于生产环境实践。各种成熟的监控平台都能支持复杂的需求/场景,本文不会涉及——因为我不会。
C Grafana与Prometheus
开源监控平台的选择有很多,我永远讨厌Nagios和Icinga综合考虑之后呢,我选择了GrafanaLabs的云服务,因为这样省钱——一分不花。您可以自建Grafana服务,也可以直接使用他家的云服务(监控即服务,MaaS)。免费的额度有限制,不过我的过家家数据量很小,远远达不到限额。
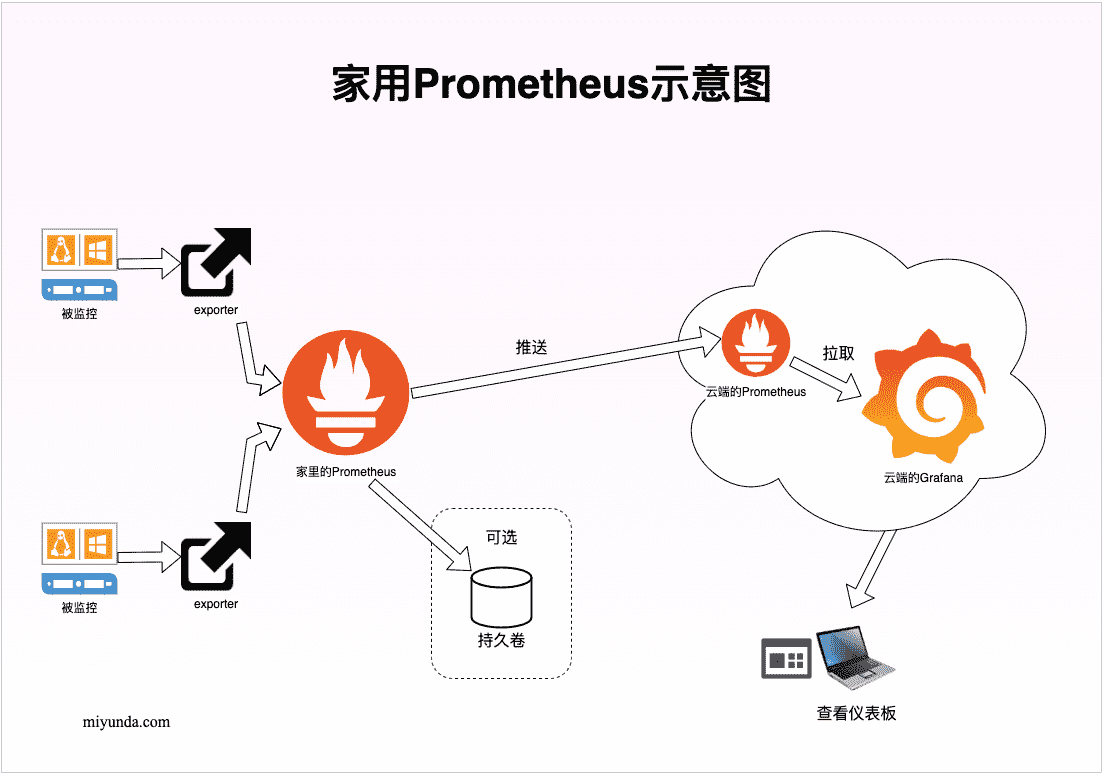
Prometheus家用示意图
大概架构是这样的:在被监控的对象附近,我们部署一个或多个exporter,主动拉取被监控对象的各项信息;然后我们还有一个或多个Prometheus,它们拉取各个exporter的数据,存在数据库里,并且按照需要的方式处理,比如改写、丢弃、转发等等;Grafana负责最后的仪表板展示工作,数据来自Prometheus,既可以是拉取的,也可以是推送的。与Grafana同一个层次的还有警报管理器,也是从Prometheus得到数据,当达到我们设置的阈值时触发警报。
Dm 我的环境
其实exporter和Prometheus可以运行在同一个Linux上,甚至可以就运行在PVE上,不过我还是把它们分开运行,这样过家家的气氛浓厚些,具体有以下实验资源:
- 一个KVM虚拟的Debian Linux,运行Prometheus,机器名为Promhub.
- 一个LXC虚拟的Debian Linux,运行exporter,机器名为PVE-exporter.
- 一个运行PVE的Linux,被监控。
- GrafanaLabs的云服务,包括一个Prometheus实例和一个Grafana实例。
Em 安装
被监控端的准备工作
在本例中,exporter收集信息是通过访问PVE的API来实现的,我们就得先创建API用户并且授权。
创建角色并赋予其权限(我也不知道需要哪些权限,我看着字面意思猜的,估计差不多):
sudo pveum role add prometheus -privs "VM.Monitor VM.Audit Datastore.Audit Pool.Audit SDN.Audit Sys.Audit"
创建用户:
sudo pveum user add prometheus-svc@pam
给它关联角色:
sudo pveum aclmod / -user prometheus-svc@pam -role prometheus
给它生成API的验证凭据(不要傻乎乎滴分享给别人):
sudo pveum user token add prometheus-svc@pam prometheus-token --privsep=0
┌──────────────┬──────────────────────────────────────┐
│ key          │ value                                │
╞══════════════╪══════════════════════════════════════╡
│ full-tokenid │ prometheus-svc@pam!prometheus-token  │
├──────────────┼──────────────────────────────────────┤
│ info         │ {"privsep":"0"}                      │
├──────────────┼──────────────────────────────────────┤
│ value        │ 1c293b5d-d8e5-4047-b3b0-10f2b687921d │
└──────────────┴──────────────────────────────────────┘
exporter
我是启动了一台LXC的虚拟机,名字叫PVE-exporter。先给它准备一个服务账号,exporter将运行在此账号下。
sudo useradd -c "pve exporter" -m -s /bin/false pve-exporter
然后准备文件夹和文件,存放API信息。
sudo mkdir /etc/exporter
sudo nano /etc/exporter/pve.yml
上面文件的内容大概是:
- 不要在生产环境这样做,安全凭据这样直接硬编码是不可以的。
default:
    user: prometheus-svc@pam
    token_name: "prometheus-token"
    token_value: "1c293b5d-d8e5-4047-b3b0-10f2b687921d"
然后设置文件权限:
sudo chown root.pve-exporter /etc/prometheus/pve.yml
sudo chmod 640 /etc/prometheus/pve.yml
开始安装正主,它是用Python写的,我们给它一个虚拟环境:
sudo apt update
sudo apt install python3-venv
sudo su pve-exporter -s /bin/bash
cd ~
pve-exporter@PVE-exporter:~$ mkdir prometheus-pve-exporter
pve-exporter@PVE-exporter:~$  python3 -m venv ~/prometheus-pve-exporter/
pve-exporter@PVE-exporter:~$ source ~/prometheus-pve-exporter/bin/activate
(prometheus-pve-exporter) pve-exporter@PVE-exporter:~$ pip install prometheus-pve-exporter
...
(prometheus-pve-exporter) pve-exporter@PVE-exporter:~$ ls prometheus-pve-exporter/bin/pve_exporter
prometheus-pve-exporter/bin/pve_exporter
注册为服务:
sudo tee /etc/systemd/system/prometheus-pve-exporter.service<<EOF
[Unit]
Description=Prometheus exporter for Proxmox VE
Documentation=https://github.com/znerol/prometheus-pve-exporter

[Service]
Restart=always
User=pve-exporter
ExecStart=/home/pve-exporter/prometheus-pve-exporter/bin/pve_exporter /etc/exporter/pve.yml

[Install]
WantedBy=multi-user.target
EOF
启动服务:
sudo systemctl daemon-reload
sudo systemctl start prometheus-pve-exporter
sudo systemctl enable prometheus-pve-exporter
systemctl status prometheus-pve-exporter
sudo ss -lntp | grep 9221
可以用浏览器试试,或者用命令也行:
curl -s "localhost:9221/pve?target=<pve的FQDN>"
应该会看到类似的反馈:
pve_version_info{release=“7.2”,repoid=“ca9d43cc”,version=“7.2-4”} 1.0
放在一边备用。
Prometheus
这里切换到另一台Debian服务器,名叫Promhub.
注:我发稿时(2022年夏天)的版本是2.39.1,各位同学根据实际情况自己改下第一行。
wget https://github.com/prometheus/prometheus/releases/download/v2.39.1/prometheus-2.39.1.linux-amd64.tar.gz
tar xvfz prometheus-*.tar.gz
cd prometheus-*
./prometheus --version
sudo mv prometheus promtool /usr/local/bin/
sudo mkdir  /etc/prometheus
sudo mv prometheus.yml  /etc/prometheus/prometheus.yml
sudo mv consoles/ console_libraries/ /etc/prometheus/
注册为服务:
sudo tee /etc/systemd/system/prometheus.service<<EOF

[Unit]
Description=Prometheus
Documentation=https://prometheus.io/docs/introduction/overview/
Wants=network-online.target
After=network-online.target

[Service]
Type=simple
User=prometheus
Group=prometheus
ExecReload=/bin/kill -HUP $MAINPID
ExecStart=/usr/local/bin/prometheus \
  --config.file=/etc/prometheus/prometheus.yml \
  --storage.tsdb.path=/var/lib/prometheus \
  --web.console.templates=/etc/prometheus/consoles \
  --web.console.libraries=/etc/prometheus/console_libraries \
  --web.listen-address=0.0.0.0:9090 \
  --web.external-url=

SyslogIdentifier=prometheus
Restart=always

[Install]
WantedBy=multi-user.target
EOF
顺便我们从上面的命令观察到它的无需重启动即可载入新配置的方法之一:kill -HUP $MAINPID .
接下来准备服务账号和文件权限:
sudo groupadd --system prometheus
sudo useradd -s /sbin/nologin --system -g prometheus prometheus
sudo mkdir /var/lib/prometheus
sudo chown prometheus:prometheus /var/lib/prometheus
for i in rules rules.d files_sd; do sudo mkdir -p /etc/prometheus/${i}; done
启动服务:
sudo systemctl daemon-reload
sudo systemctl start prometheus
sudo systemctl enable prometheus
systemctl status prometheus
sudo netstat -nlp | grep prome
将PVE-exporter介绍给promhub
修改promhub上的文件
sudo nano /etc/prometheus/prometheus.yml
查找其中这样的片段:
scrape_configs:
  # The job name is added as a label `job=<job_name>` to any timeseries scraped from this config.
  - job_name: "prometheus"

    # metrics_path defaults to '/metrics'
    # scheme defaults to 'http'.

    static_configs:
      - targets: ["localhost:9090"]
这是它自己刮削自己数据的设置,我们在下面加入一些新的内容,看起来像是这样:
scrape_configs:
  # The job name is added as a label `job=<job_name>` to any timeseries scraped from this config.
  - job_name: "prometheus"

    # metrics_path defaults to '/metrics'
    # scheme defaults to 'http'.

    static_configs:
      - targets: ["localhost:9090"]
  - job_name: 'pve-exporter'
    static_configs:
      - targets: ["exporter:9221"]
    relabel_configs:
    - source_labels: [__param_target]
      target_label: instance
    metrics_path: /pve
    params:
      module: [default]
      target: [<我的pve的FQDN>]
然后载入Prometheus的新配置就好了。访问http://promhub:9090即可浏览各项监控数据:
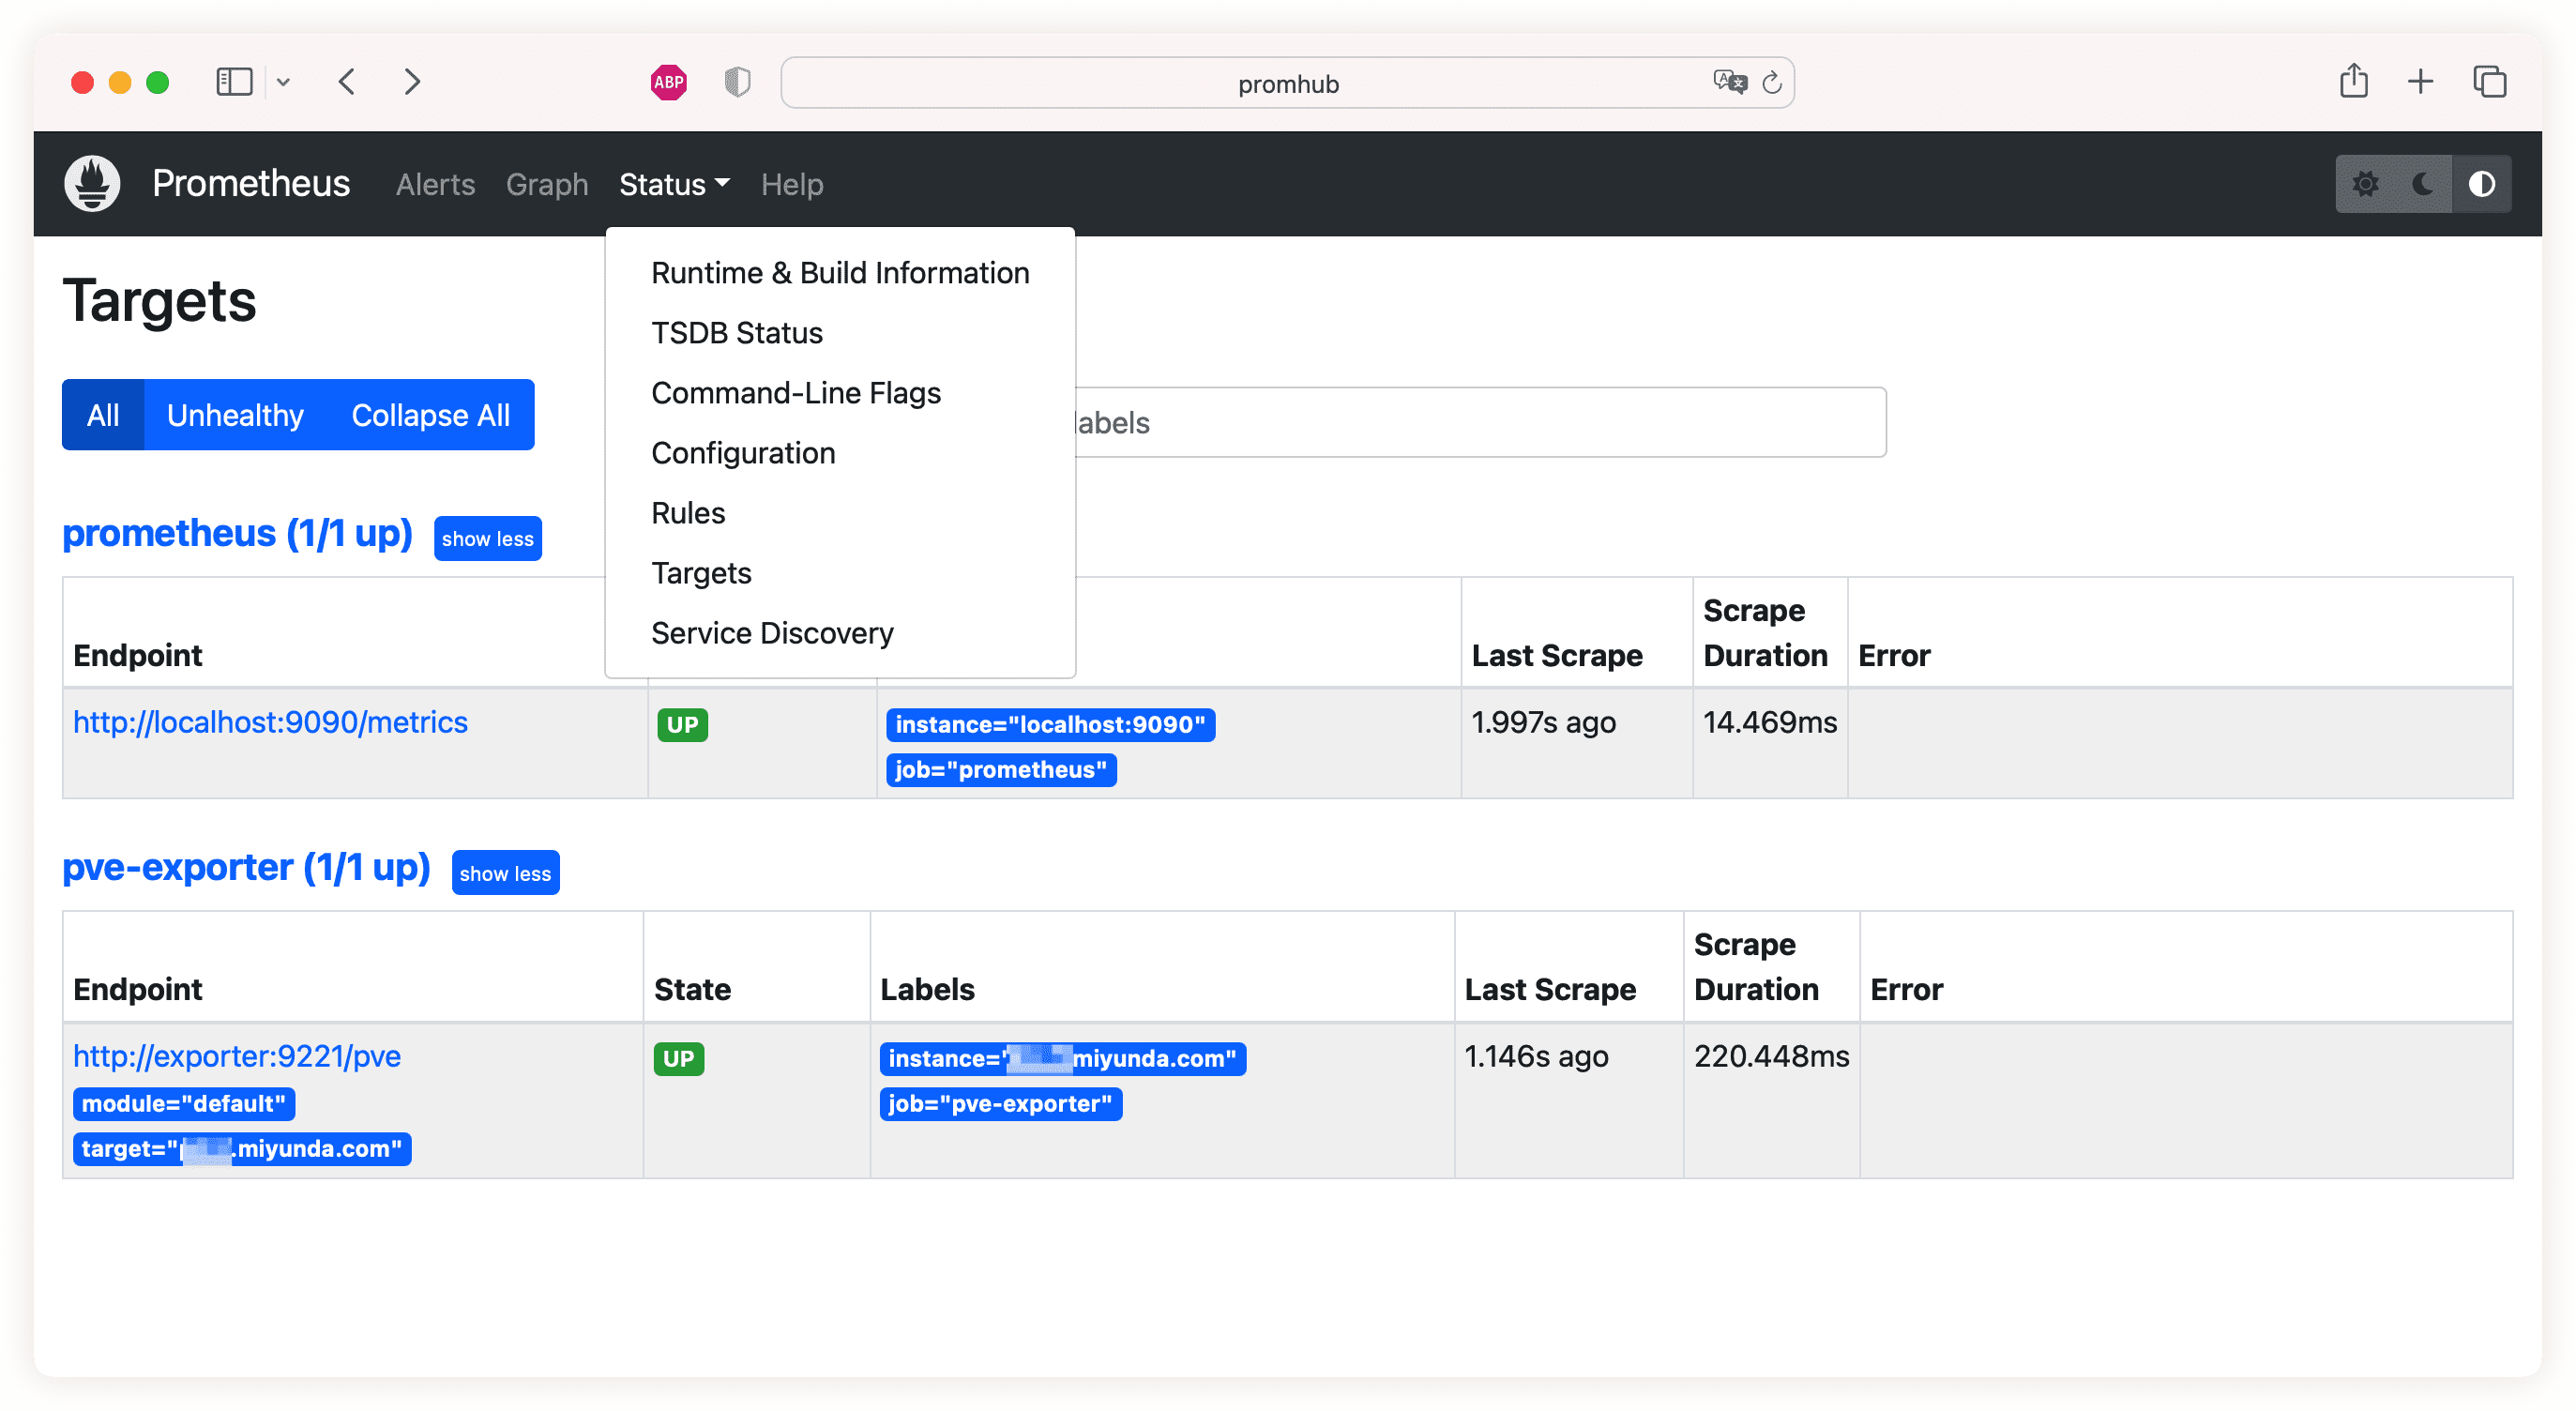
Prometheus target
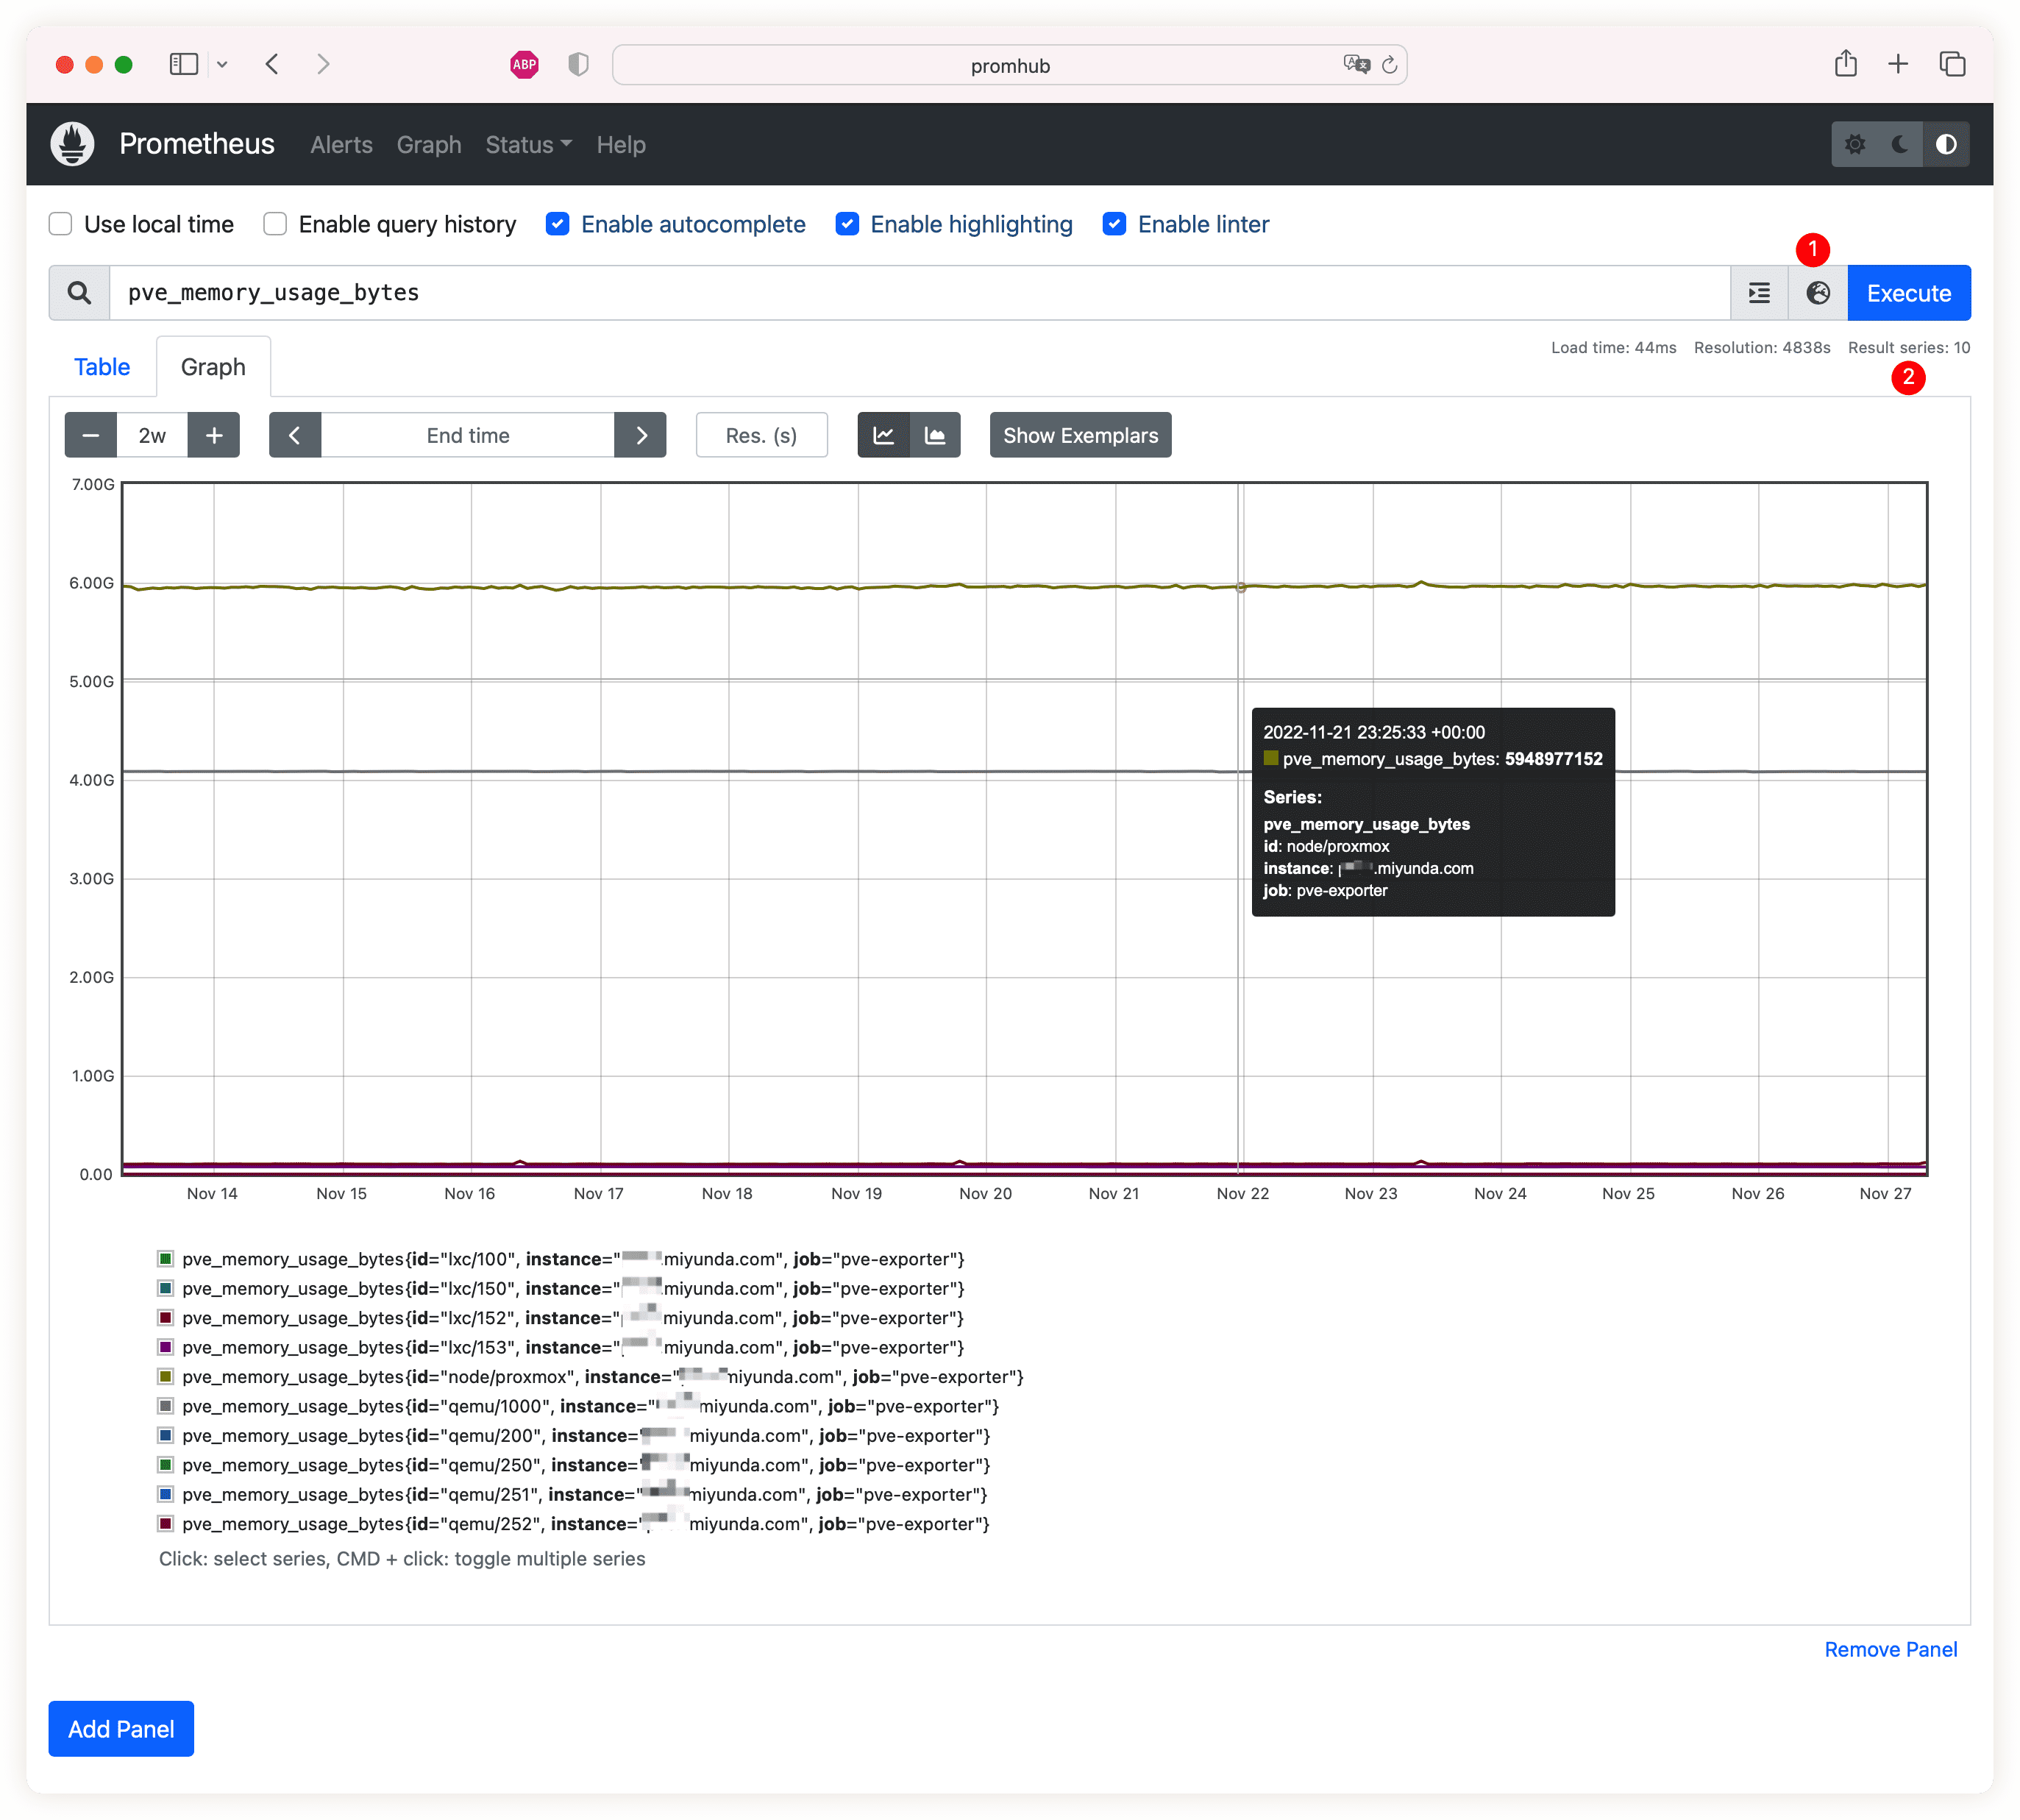
Prometheus metrics explorer
F 信息推送到云端
假如不使用GrafanaLabs的云服务的话,就可以直接安装一台Grafana服务器并且让它拉取promhub暴露出来的API即可。开头说过了我是要用他家云服务的,第一步先去注册个账号,免费的:https://grafana.com/ 。然后它会分配给我们一个云端Prometheus,我们还需要生成一个API凭据,当本地Prometheus向云端Prometheus推送数据的时候要验证。
在个人账号的页面我们点开Prometheus,找到给我们提供的remote_write的地址,看起来这样:
还有用户名/进程id,一串数字的,再加上生成的API凭据,就可以开始编辑本地的Prometheus(promhub)配置文件了:
sudo nano /etc/prometheus/prometheus.yml
在文件的最开头加入下面的设置:
remote_write:
- url: https://foobar.grafana.net/api/prom/push
  basic_auth:
    username: <我的用户名/进程id>
    password: <我的API凭据>
载入新设置然后稍等片刻,就可以去浏览下云端的Prometheus,看看数据有木有推送过去:
https://<我的名>.grafana.net/explore
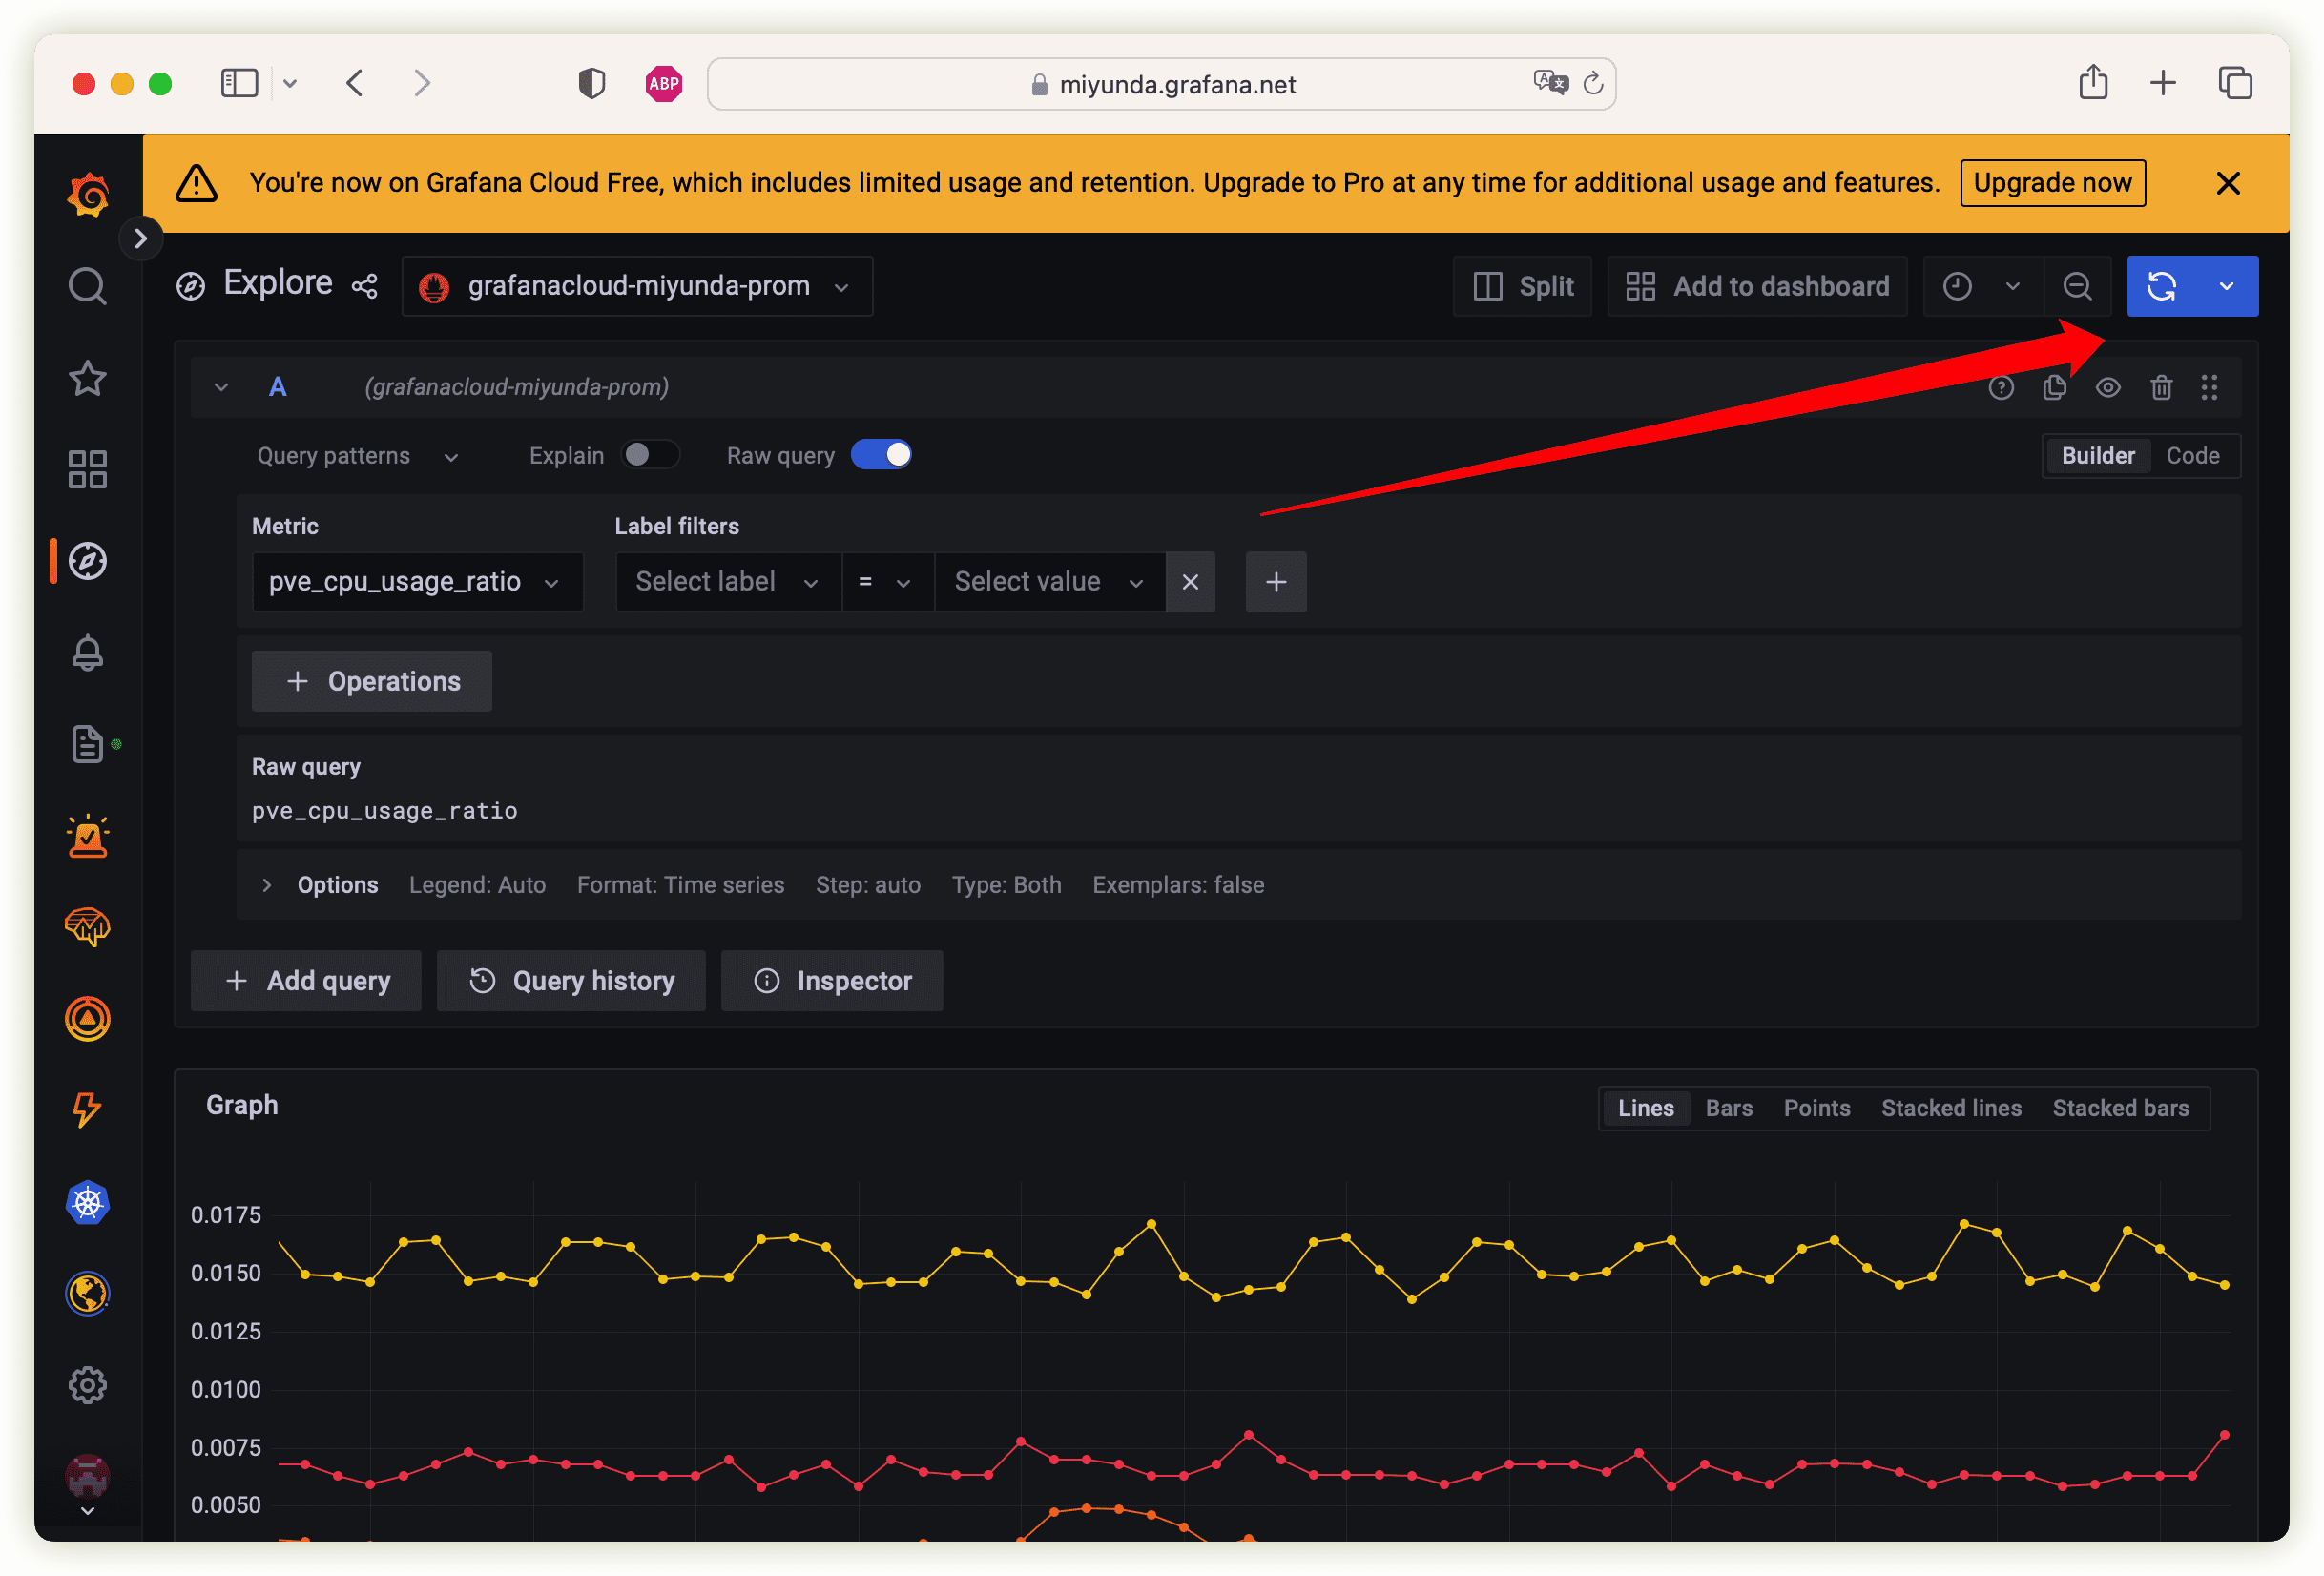
Grafana explore
G 展示我们的仪表板
甲方领导最喜欢的东西来了。 各位可以随心所欲搞设计,反正数据推送过来了,怎么排版就看各位的审美了。
Grafana官方也提供了一些现成的:https://grafana.com/grafana/dashboards/14711-proxmox-ve-nodes/. 觉得哪个好就把URL直接粘贴在导入仪表板的界面即可,也可以下载JSON文件——后者更适合内网私有Grafana.
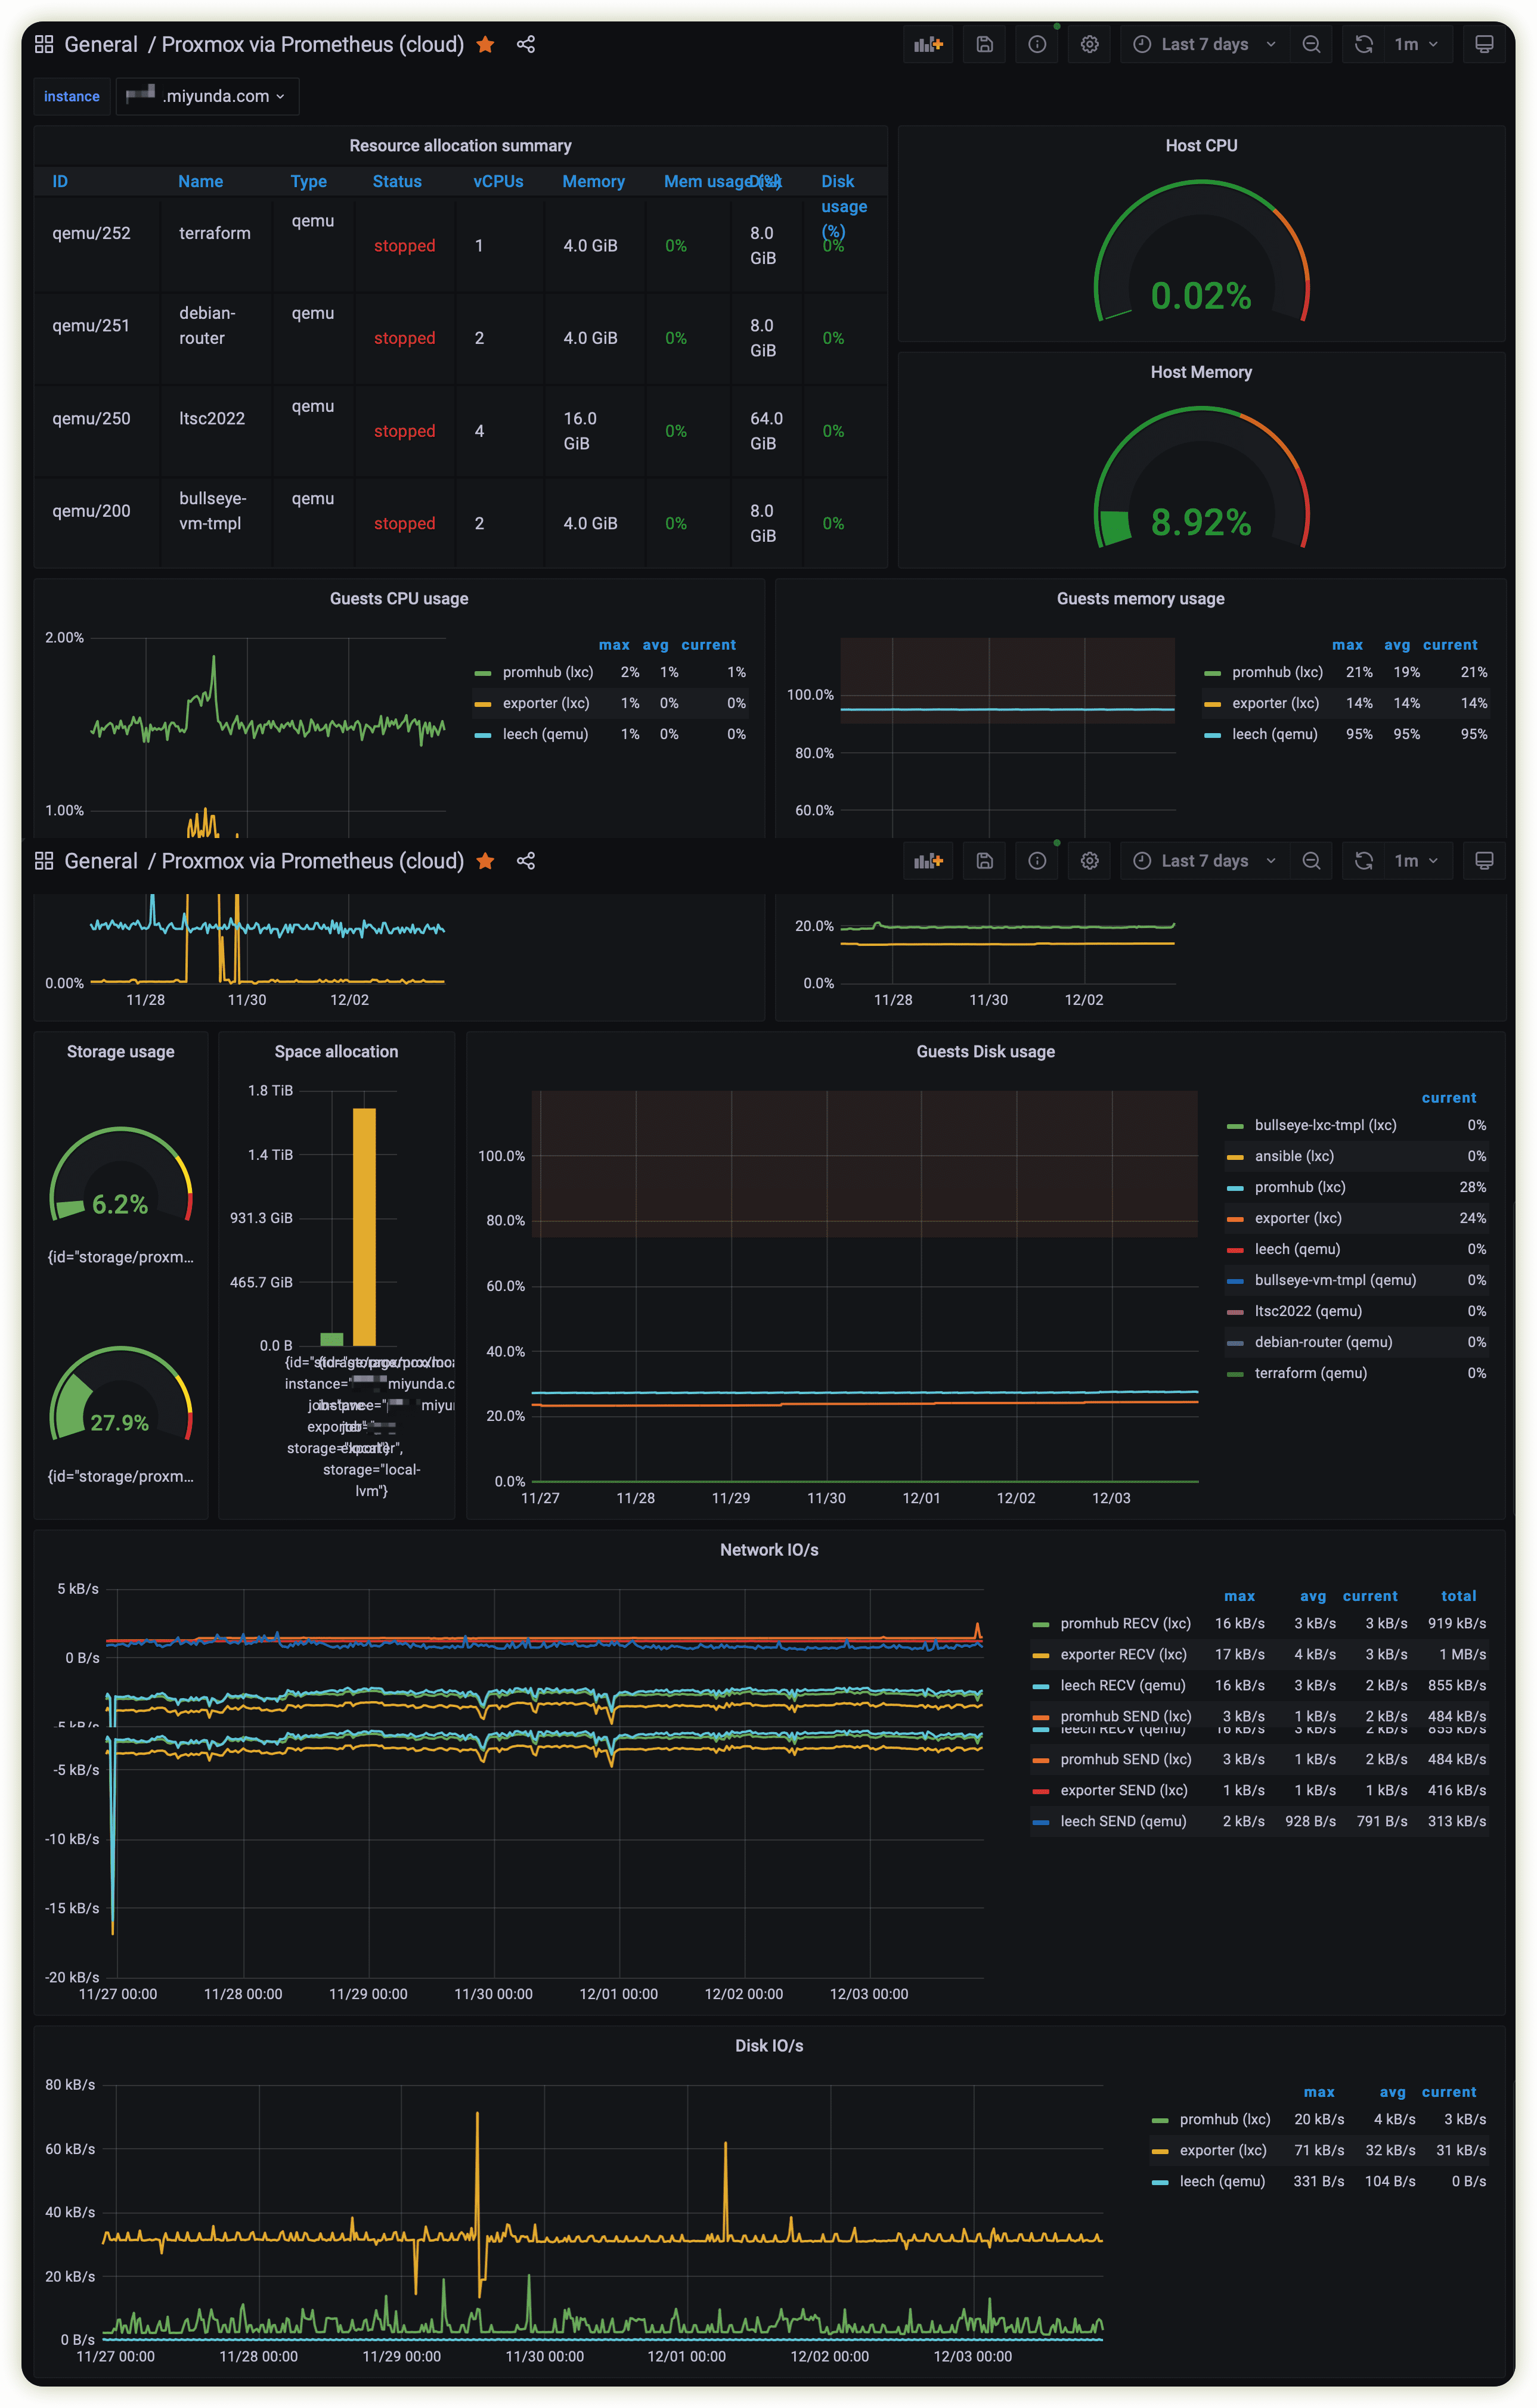
Grafana仪表板
好了,看过了就等于会了,虽然本次举例是用PVE,但是Prometheus/Grafana支持很多操作系统/服务的,方法都是类似的,赶紧动手搭一套吧~~
Am 返场
Prometheus载入新设置
上文提供了一种方法,就是kill -HUP $MAINPID,这个分人,有人觉得方便,有人觉得不顺手。它还支持另一种方法,是访问API,这种方法默认木有启用,需要的话就这样:
先编辑下服务设置:
sudo nano /etc/systemd/system/prometheus.service
找到启动那行,加上--web.enable-lifecycle
保存之后让系统知道服务的设置变化了:
sudo systemctl daemon-reload
sudo systemctl restart prometheus
systemctl status prometheus
需要载入新配置的时候就:
curl -s -XPUT <主机名或者地址比如localhost>:9090/-/reload
过滤
exporter在收集数据的时候获得了很多信息,信息都被本地Prometheus拉取过去,最后从本地推送到云端Prometheus,为了减少系统性能开销,节省配额的使用,我们可能不想把所有的信息都推送到云端。我们可以在Prometheus的Web界面浏览并记下不需要的性能指标,然后去编辑设置文件:
sudo nano /etc/prometheus/prometheus.yml
在其中加入类似下面内容:
remote_write:
- url: https://foobar.grafana.net/api/prom/push
  basic_auth:
    username: <我的用户名/进程id>
    password: <我的API凭据>
  write_relabel_configs:
  - source_labels: ["__name__", "id"]
    regex: "pve_cpu_usage_ratio;lxc/100"
    action: drop
···
以上新增的段落告诉本地的Prometheus不要转发lxc/100的CPU占用率信息。看过前面几篇文章的同学知道,我有一台“模版机”,id是lxc/100 ,这台虚拟机长期关机,转发它的CPU占用率信息显然木有意义,将其在推送前过滤掉更合理。
保存并载入新设置后稍等片刻,在云端Prometheus就浏览不到上述数据了,而在本地的Prometheus上面它还存在。
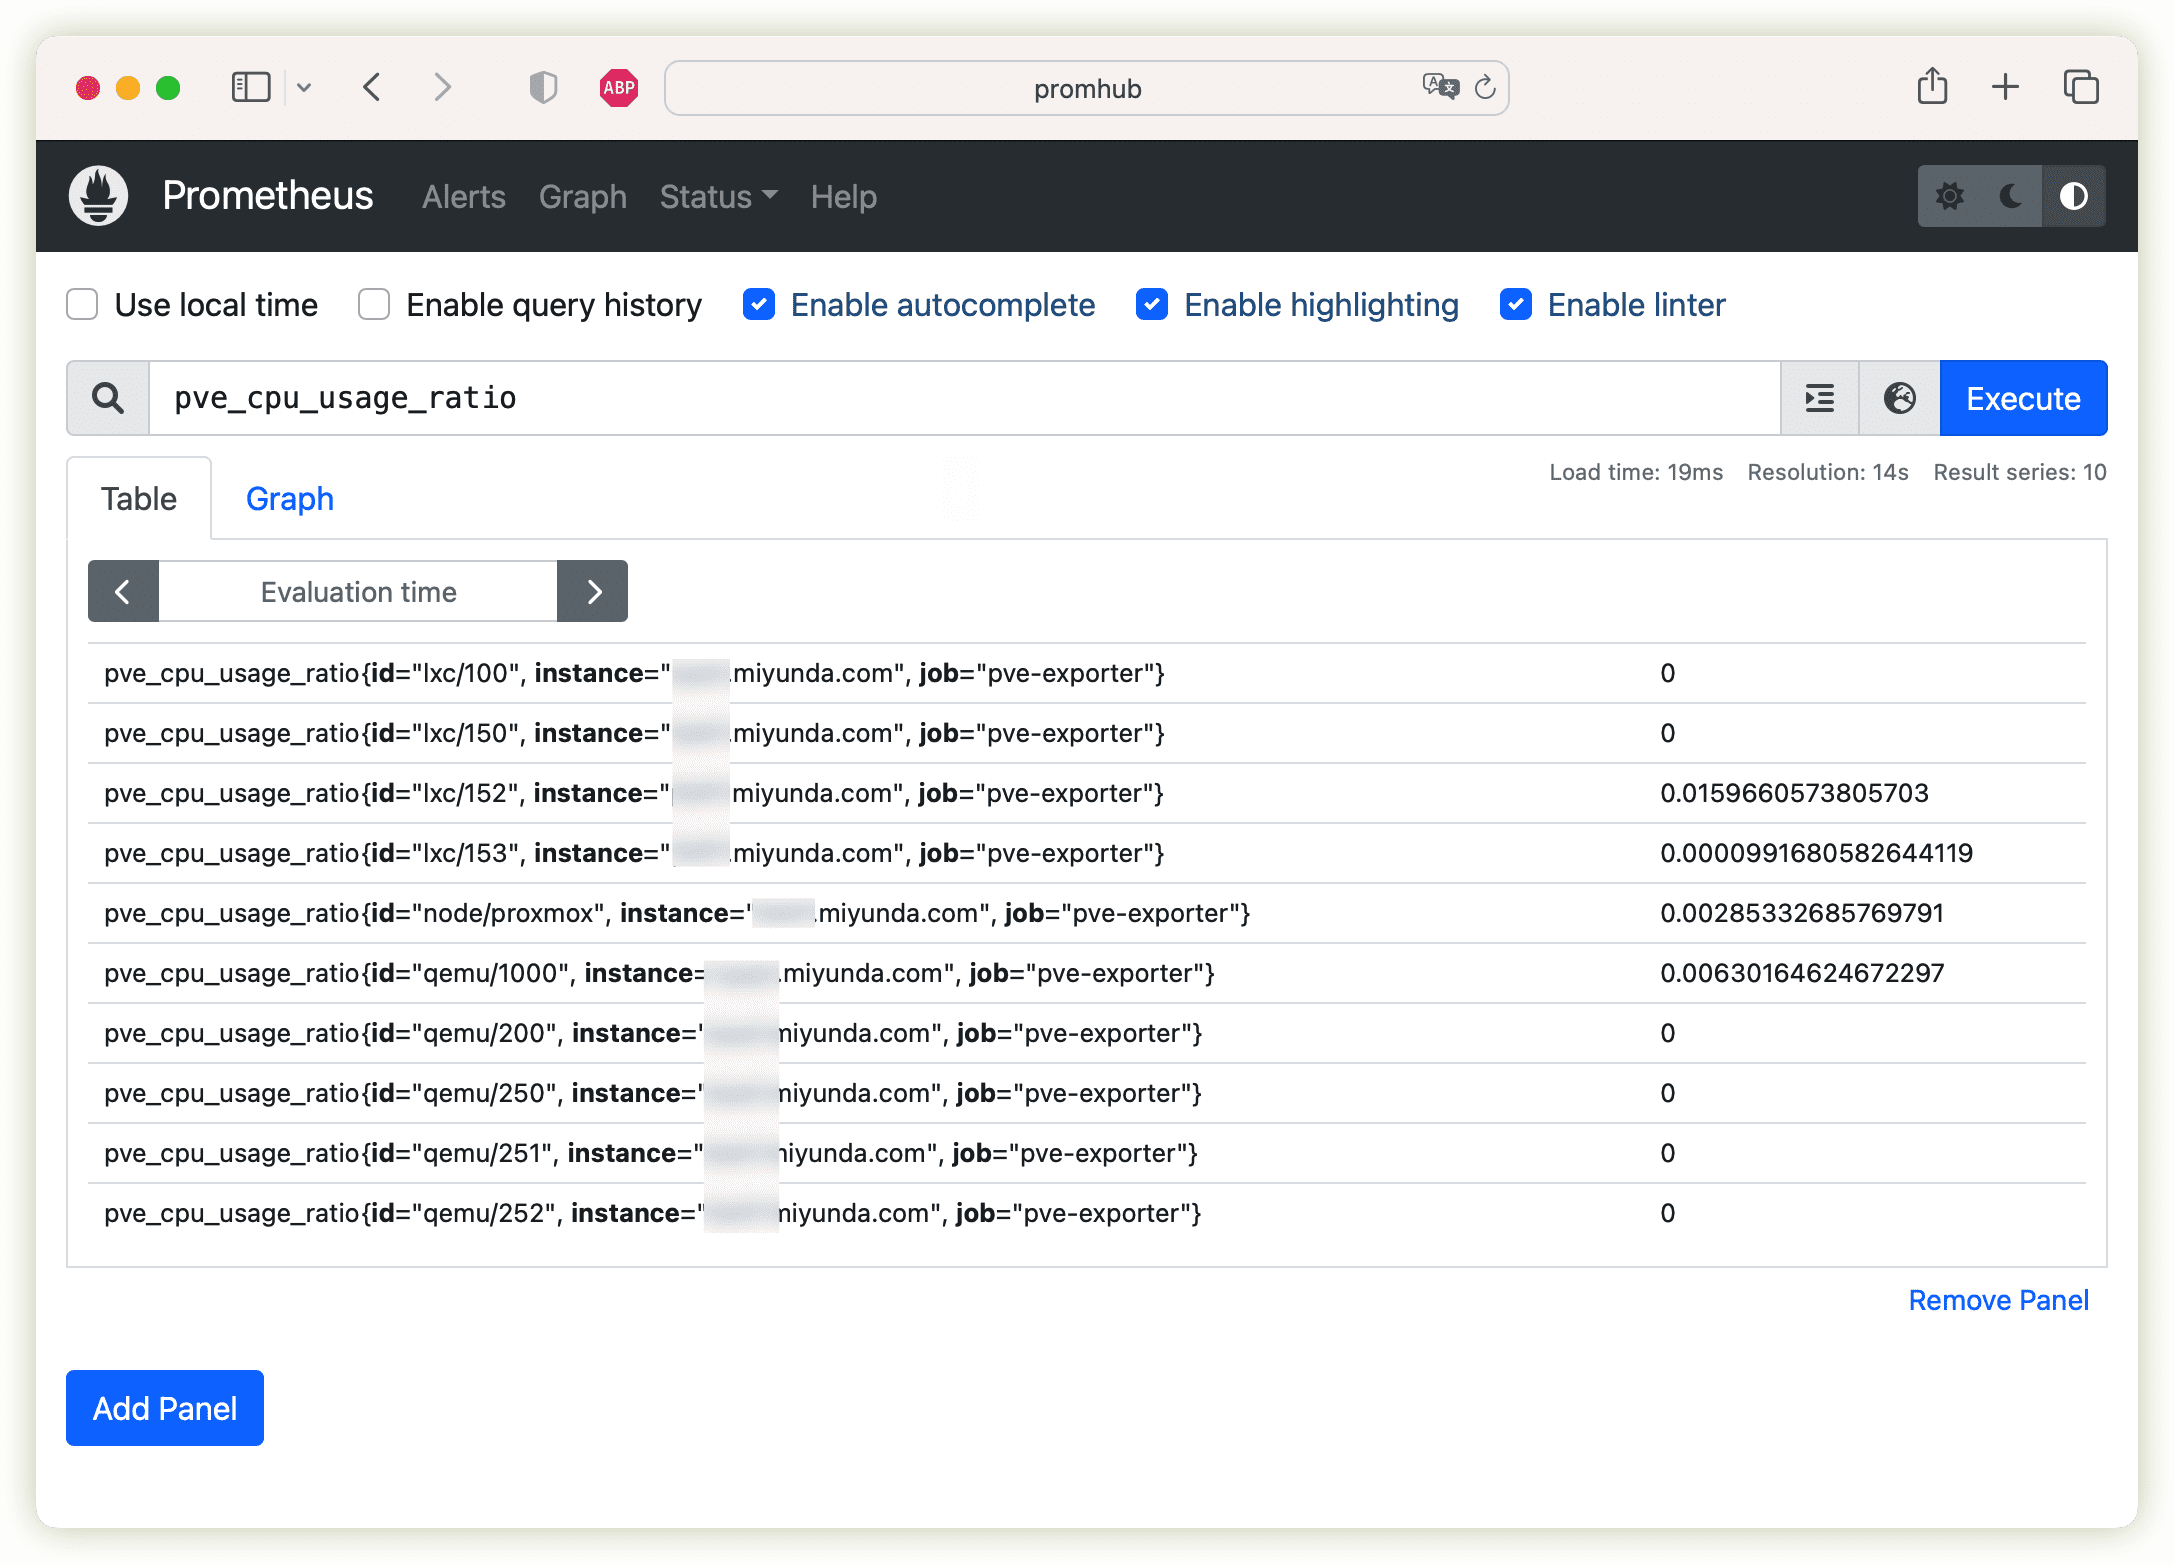
Prometheus本地浏览
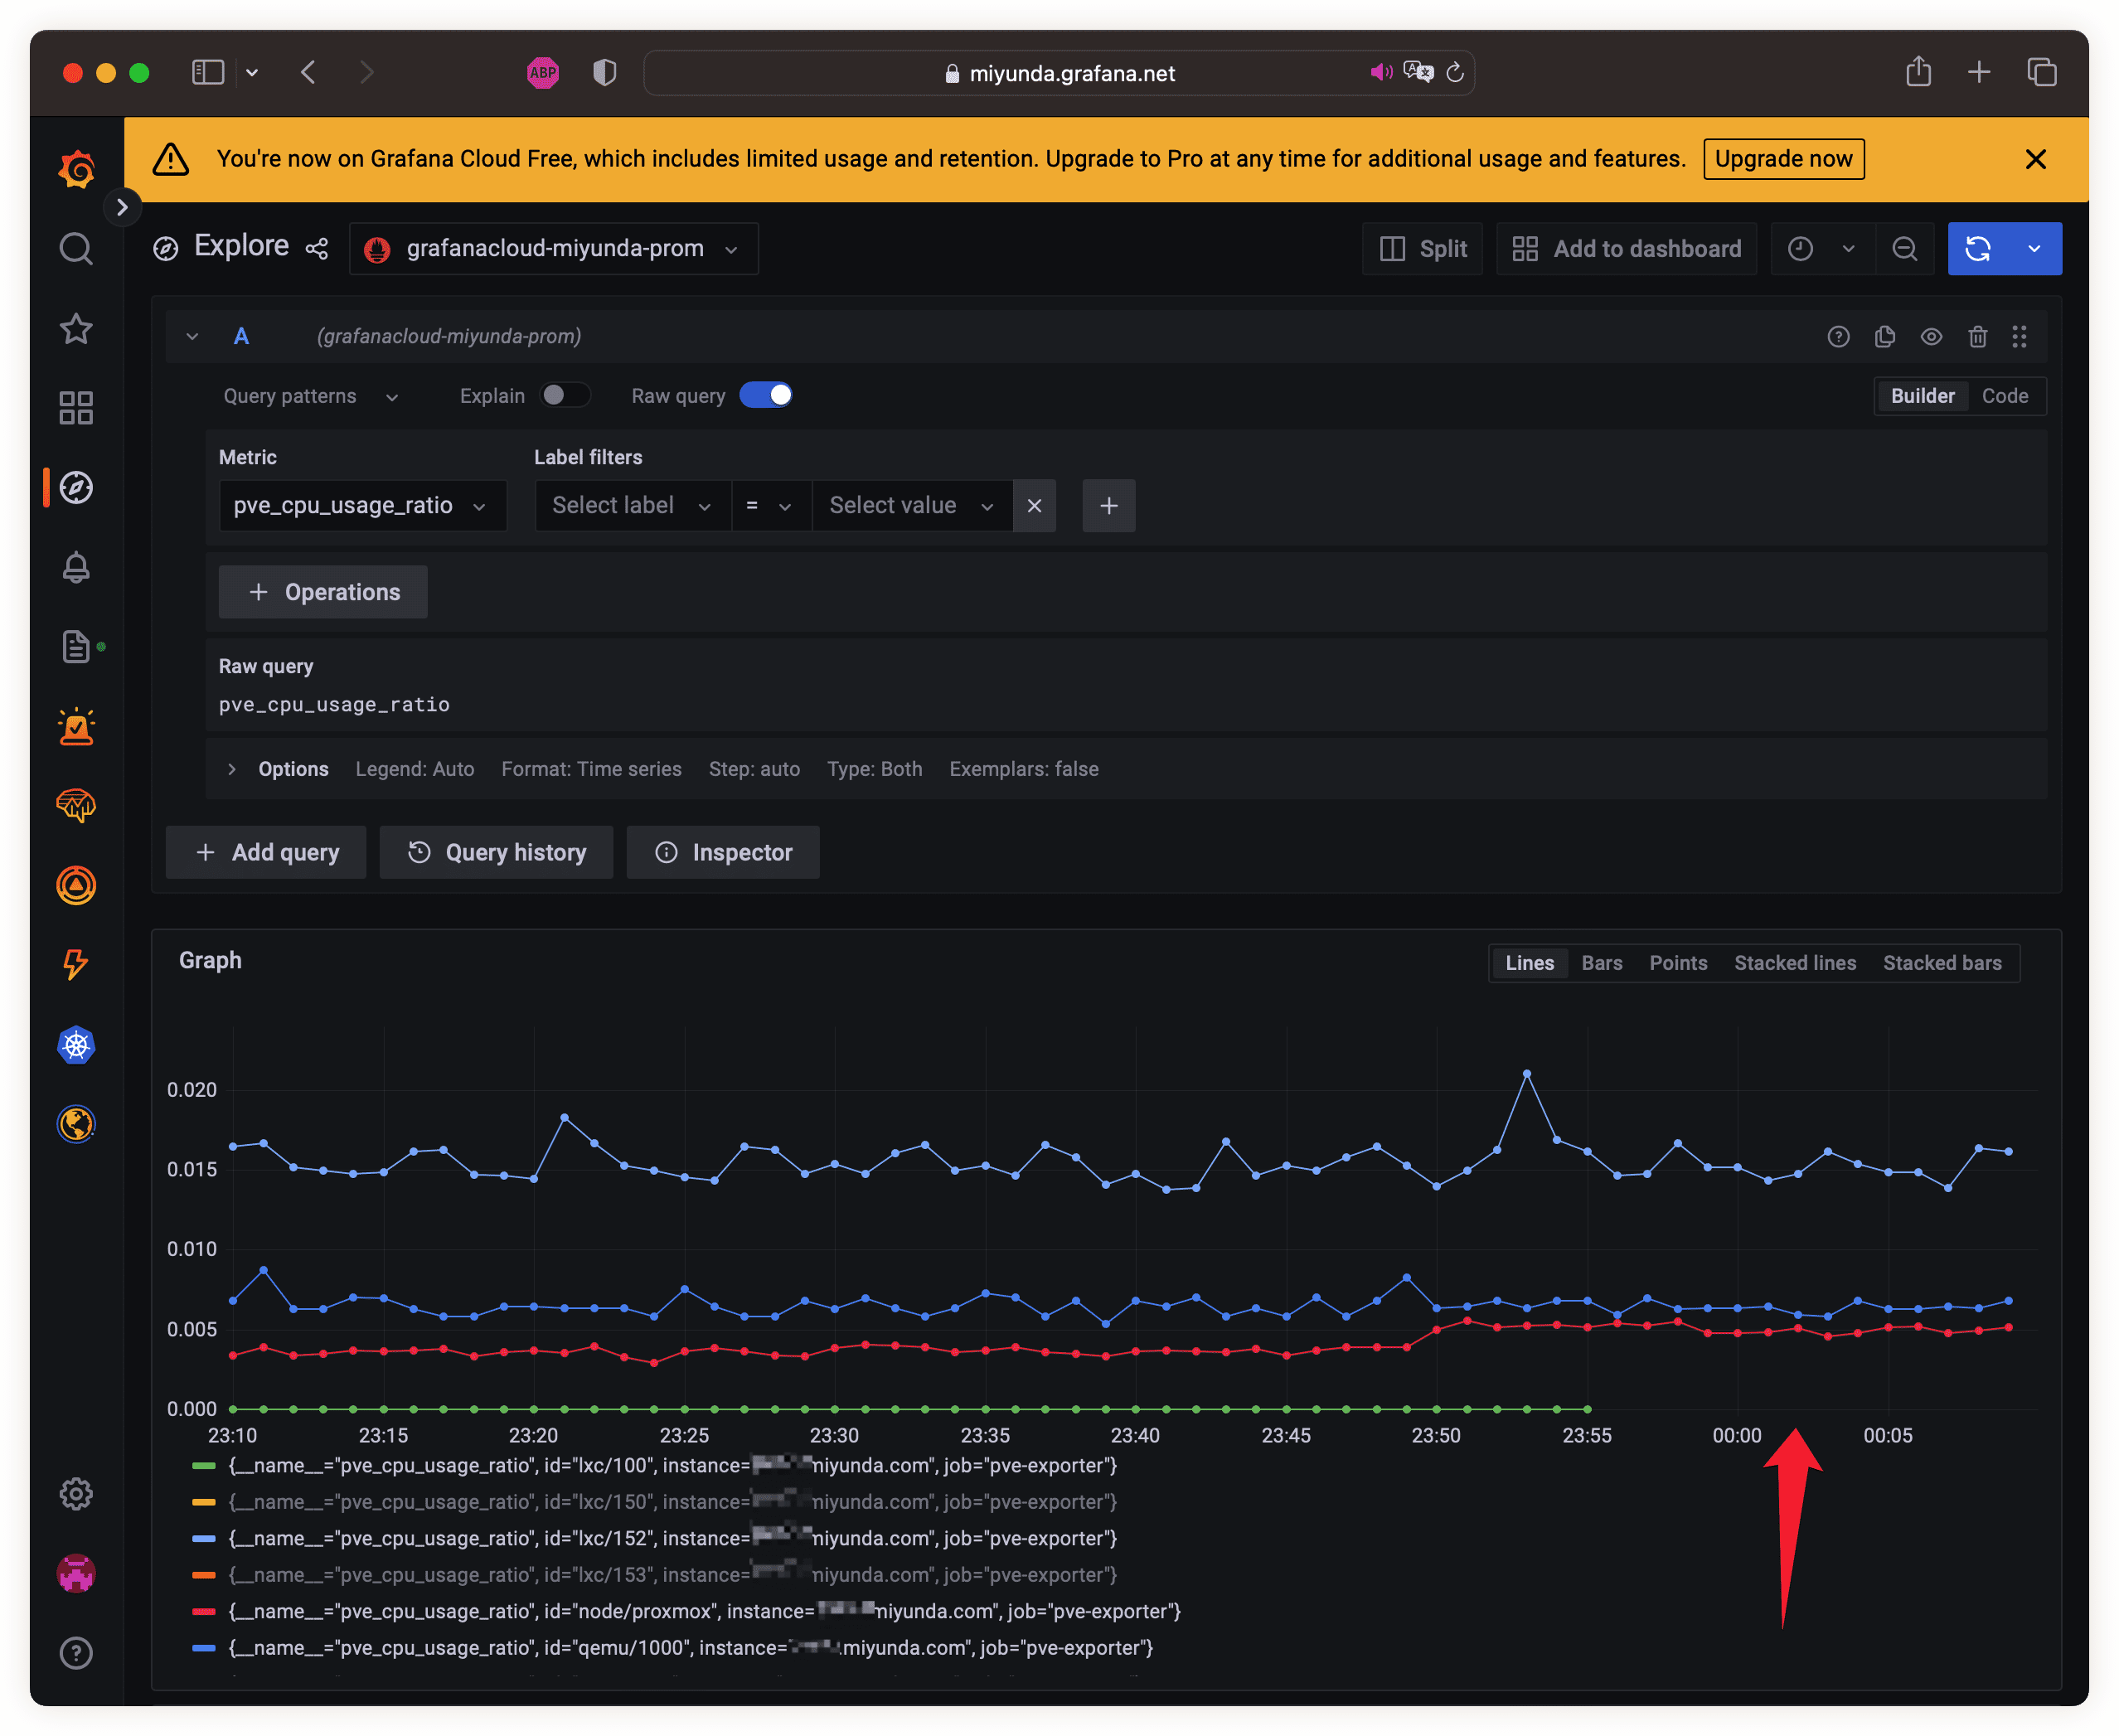
Prometheus remote write drop
以上只是为了演示如何丢弃某单项性能数据,在我实际的设置应该是这样的:
remote_write:
- url: https://foobar.grafana.net/api/prom/push
  basic_auth:
    username: <我的用户名/进程id>
    password: <我的API凭据>
  write_relabel_configs:
  - source_labels: [id]
    regex: lxc/100|qemu/200
    action: drop
以上将两台机器的所有信息都丢弃——我有两个模版机。
假如需要从一开始就不要那些数据的话,就得在scrape_config里面告诉本地Prometheus如何刮削,方法是类似的,详见官方文档。
反向代理
假如不喜欢推送到云端,而是喜欢让云端过来拉取的话可以考虑将本地的Prometheus放在反向http代理后面,以Caddy为例,大概是这样的:
promhub.foobar.com {
  encode gzip
  reverse_proxy  localhost:9090
  tls [email protected] {
    dns cloudflare {env.CF_API_TOKEN}
  }
  log {
    output file /var/log/caddy/prometheus/access.log {
    #roll_size 100mb
    roll_keep 10
    roll_keep_for 168h
    }
  }
}
其中无法开放80/443端口的话需要使用Cloudflare的DNS来验证对域名的控制权(以获得SSL证书)。
返场结束了。谢谢观看~
评论